Faster Inference on the M2
Research
The Apple M2 GPU enters a low-power state approximately
2 ms after its command queue drains. While the active
dynamic voltage and frequency scaling (DVFS) state persists
across short power-gating windows of roughly 100 ms,
idle durations between 200 ms and 500 ms force a reset back
to the lowest DVFS frequency floor (444 MHz). When new
workloads arrive, the firmware performance controller
enforces a 10–40 ms latency floor at this baseline before
ramping up. Reaching the peak frequency (1398 MHz) requires
50–100 ms under continuous queue saturation, but ~440 ms
under synchronous kernel submission loops. During this
initial ramp phase, compute-bound kernels achieve only 32%
of their steady-state throughput resulting in a cumulative
loss of 192 ms of GPU execution time within the first 500 ms
window. Furthermore, inter-buffer dispatch overhead severely
penalizes frequency scaling. If the command queue is
empty for over ~0.5 ms between buffers the controller fails
to scale up entirely. This locks the GPU at 444 MHz
indefinitely regardless of compute saturation during active
cycles.
For local inference, these power state dynamics impose a
deterministic latency penalty on any request following an
idle period. A 16-token prefill of Llama-3.2-3B-Instruct-4bit
in MLX requires 149.9 ms cold (after 1 s of idle)
versus 116.4 ms warm, with the cold-start penalty expanding
to 53 ms at a 512-token prompt length. Warm state completely
decays after 700 ms to 1 s of inactivity. This cold-start
latency is completely mitigated by dispatching a single 6 ms dummy
kernel 5 ms prior to the request. Maintaining a pipeline of
enqueued command buffers allows an inference runtime to absorb
host CPU dispatch gaps provided the queued workload covers the
idle duration. Alternatively, keeping a single 32-thread threadgroup
resident on the GPU eliminates 58–95% of the prefill penalty in
MLX and 100% of the penalty in llama.cpp for a negligible 0.6 W
power draw, incurring zero measurable degradation to prefill or
decode throughput.
Introduction
Decode performance on Apple Silicon is primarily bandwidth-bound, and
optimization efforts revolve on moving model weights across the memory bus.
Conversely, prefill execution, long-context attention, and time to
first token (TTFT) are compute-bound phases whose performance
directly scales with dynamic GPU clock frequency.
The GPU operating point is set by a firmware performance
controller running on an embedded ARM coprocessor, which samples
hardware utilization to select among eight performance states (p-states).
For the M2 architecture (t8112), these controller parameters
are publicly documented via the Asahi Linux driver initialization sequence
(a 2 ms idle-off delay, an 8 ms sampling window, a baseline p-state of 1,
a 90% utilization boost threshold, and an operating frequency range
spanning 444 MHz to 1398 MHz.) This slow frequency ramp behavior is well
known among real-time graphics developers who typically mitigate this
latency by maintaining persistent, lightweight dummy kernels to prevent clock decay.
I sought to determine the precise impact of these controller dynamics on macOS
inference runtimes and how runtime submission architecture influences
power state transitions. Key empirical questions include:1
- The magnitude and rate of clock decay following queue depletion
- The duration spent at the baseline p-state upon workload resumption
- Frequency scaling trajectories as a function of command buffer submission strategy
- The maximum allowable inter-buffer queue idle time before frequency boosting is inhibited
- The net latency penalty on TTFT in frameworks like MLX and llama.cpp, alongside the overhead of mitigation techniques
Discovery
GPU core clock frequency was measured using a memory independent, unvectorizable benchmark based on a dependent fused multiply-add (FMA) instruction chain.
kernel void alu(device float* sink [[buffer(0)]], constant uint& iters [[buffer(1)]],
                uint gid [[thread_position_in_grid]]) {
    float a = float(gid) * 1e-6f, b = 1.0000001f, c = 0.9999999f;
    for (uint i = 0; i < iters; ++i) { a = fma(a, b, c); a = fma(a, c, b); }
    if (a == 12345.0f) sink[0] = a;
}
When dispatched across 65,536 threads, throughput in
GFLOP/s scales proportionally with ALU clock
frequency. With 20,000 iterations per thread,
corresponding to a 6 ms command buffer, the
benchmark achieves a peak throughput of 903 GFLOP/s.
With 2,000 iterations (0.58 ms), throughput
saturates at 872 GFLOP/s.2
Memory bandwidth is measured using a streaming read
benchmark in which each thread performs an XOR
reduction over 32 uint4 values strided by the grid
size. Under these conditions this benchmark
achieves a throughput of 94 GB/s.
kernel void stream(const device uint4* src [[buffer(0)]], device uint4* sink [[buffer(1)]],
                   constant uint& iters [[buffer(2)]], uint gid [[thread_position_in_grid]],
                   uint grid [[threads_per_grid]]) {
    uint4 acc = uint4(0);
    for (uint k = 0; k < iters; ++k) acc ^= src[gid + k * grid];
    if (all(acc == uint4(0xdeadbeefu))) sink[0] = acc;
}
I observed that a single clock-frequency probe issued immediately following a sleep interval measured 625–640 GFLOP/s. When issued mid-execution in a busy loop it measured 903 GFLOP/s. To investigate this, idle time preceding a burst of six back-to-back dispatches was swept across 30 rounds, with all gap lengths interleaved.
for round in 0..<30:
    for gap in [0, 0.5, 1, 2, 5, 10, 20, 50, 100, 200, 500, 1000] ms:
        usleep(gap)
        for k in 0..<6:
            commit(kernel); waitUntilCompleted()
            record(k, GPUEndTime - GPUStartTime, GPUStartTime - commitTime)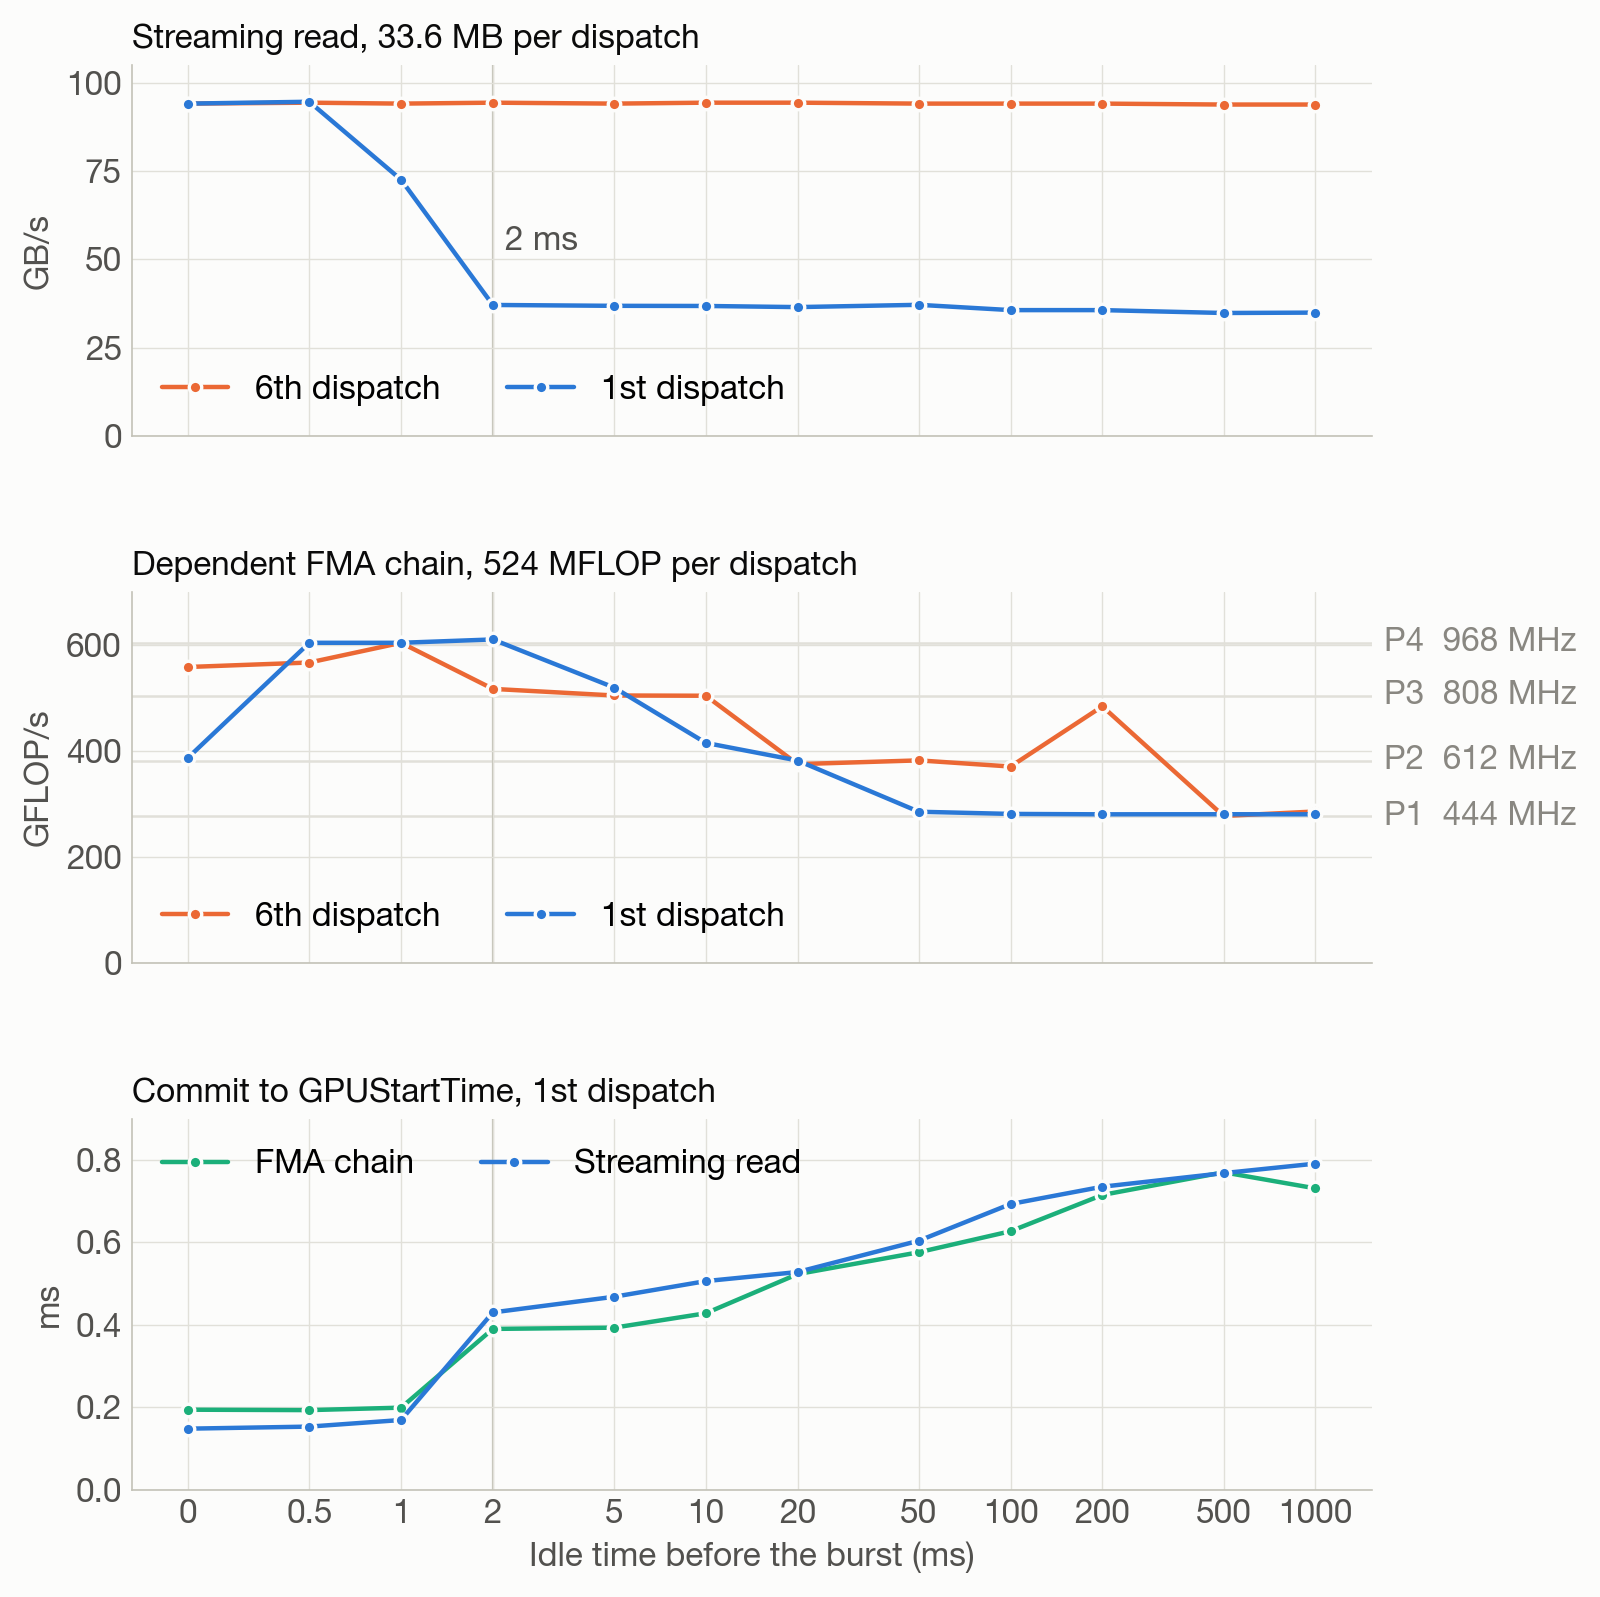
commit to GPUStartTime
of the first dispatch.
| gap (ms) | stream 1st dispatch (GB/s) | stream 6th (GB/s) | FMA 1st dispatch (GFLOP/s) | commit to GPU start, stream (ms) |
|---|---|---|---|---|
| 0 | 94 | 94 | 387 | 0.148 |
| 0.5 | 95 | 94 | 604 | 0.153 |
| 1 | 73 | 94 | 604 | 0.169 |
| 2 | 37 | 94 | 610 | 0.430 |
| 5 | 37 | 94 | 520 | 0.468 |
| 10 | 37 | 94 | 415 | 0.506 |
| 20 | 37 | 94 | 382 | 0.528 |
| 50 | 37 | 94 | 285 | 0.604 |
| 100 | 36 | 94 | 281 | 0.693 |
| 200 | 36 | 94 | 280 | 0.735 |
| 500 | 35 | 94 | 280 | 0.768 |
| 1000 | 35 | 94 | 280 | 0.791 |
Two changes are evident:
- At the 2 ms mark, a state transition occurs. Between a 1 and 2 ms gap, the first streaming dispatch's throughput drops from 94 to 37 GB/s, and its commit-to-start latency nearly triples, increasing from 0.15 to 0.43 ms. Beyond 2 ms, the first dispatch's GPU time remains constant regardless of whether the idle period was 2 ms or a full second (35–37 GB/s), indicating a discrete state transition rather than a continuous cooling process. Only the start latency continues to increase, reaching 0.79 ms after 1 s. The sixth dispatch consistently returns to 94 GB/s in all cases.
- Over the subsequent ~50 ms, clock frequency decays progressively. For the FMA chain, the first dispatch retains the clock frequency held prior to the gap (610 GFLOP/s at 2 ms, corresponding to the P4 state), declines to P3 by 5 ms, to P2 by 20 ms, and stabilizes precisely at P1 from 50 ms onward. Notably, the sweep itself never allows the GPU to exceed the P4 state: six 0.6 ms kernels interspersed with sleep intervals are insufficient to escape the ramp-up phase, providing an initial indication that submission pattern plays a role.
The Performance Controller
The operating-point table and controller parameters for
the t8112 SoC detailed below are derived from the Asahi
Linux driver source
(arch/arm64/boot/dts/apple/t8112.dtsi,
defaults in
drivers/gpu/drm/asahi/hw/mod.rs). These values
are passed to the GPU firmware under Linux and are in agreement
with the emperical measurements under macOS.
| p-state | frequency (MHz) | voltage (mV) |
|---|---|---|
| P1 | 444 | 603 |
| P2 | 612 | 675 |
| P3 | 808 | 710 |
| P4 | 968 | 775 |
| P5 | 1110 | 820 |
| P6 | 1236 | 875 |
| P7 | 1338 | 915 |
| P8 | 1398 | 950 |
| Parameter | Value | Description |
|---|---|---|
idle_off_delay_ms (driver default) |
2 ms | Power-gating timeout in ms. |
apple,power-sample-period |
8 | DVFS sampling interval in ms. |
apple,perf-base-pstate |
1 | Baseline wake frequency state (P1.) |
apple,perf-filter-time-constant |
5 periods | 5 × 8 ms = 40 ms window; governs maximum P1 hold duration and shallow-queue decay to P1. |
apple,perf-tgt-utilization |
85% | Target utilization for the non-boosted PID controller. |
apple,perf-boost-min-util |
90% | Boost activation threshold. |
apple,perf-boost-ce-step |
50 | Aggressive step increment. |
apple,perf-proportional-gain / -integral-gain |
14.85 / 5.94 | PID controller gain parameters governing frequency adjustment response curves. |
| OPP table | 444 … 1398 MHz | Discrete operating performance point frequencies. |
Quantized Plateaus
Taking the 0.58 ms kernel's full-speed throughput of
872 GFLOP/s as the reference, proportionality
predicts 277 GFLOP/s at P1, 382 GFLOP/s at P2, 504
GFLOP/s at P3, and 604 GFLOP/s at P4. These values
are plotted as the reference lines in Figure 1, and
were fixed prior to inspection of the measured data.
To resolve the full ramp, I issued 3000 back-to-back
synchronous dispatches following 2 s of idle (3
rounds), and 40 dispatches following 500 ms of idle
(20 rounds.)
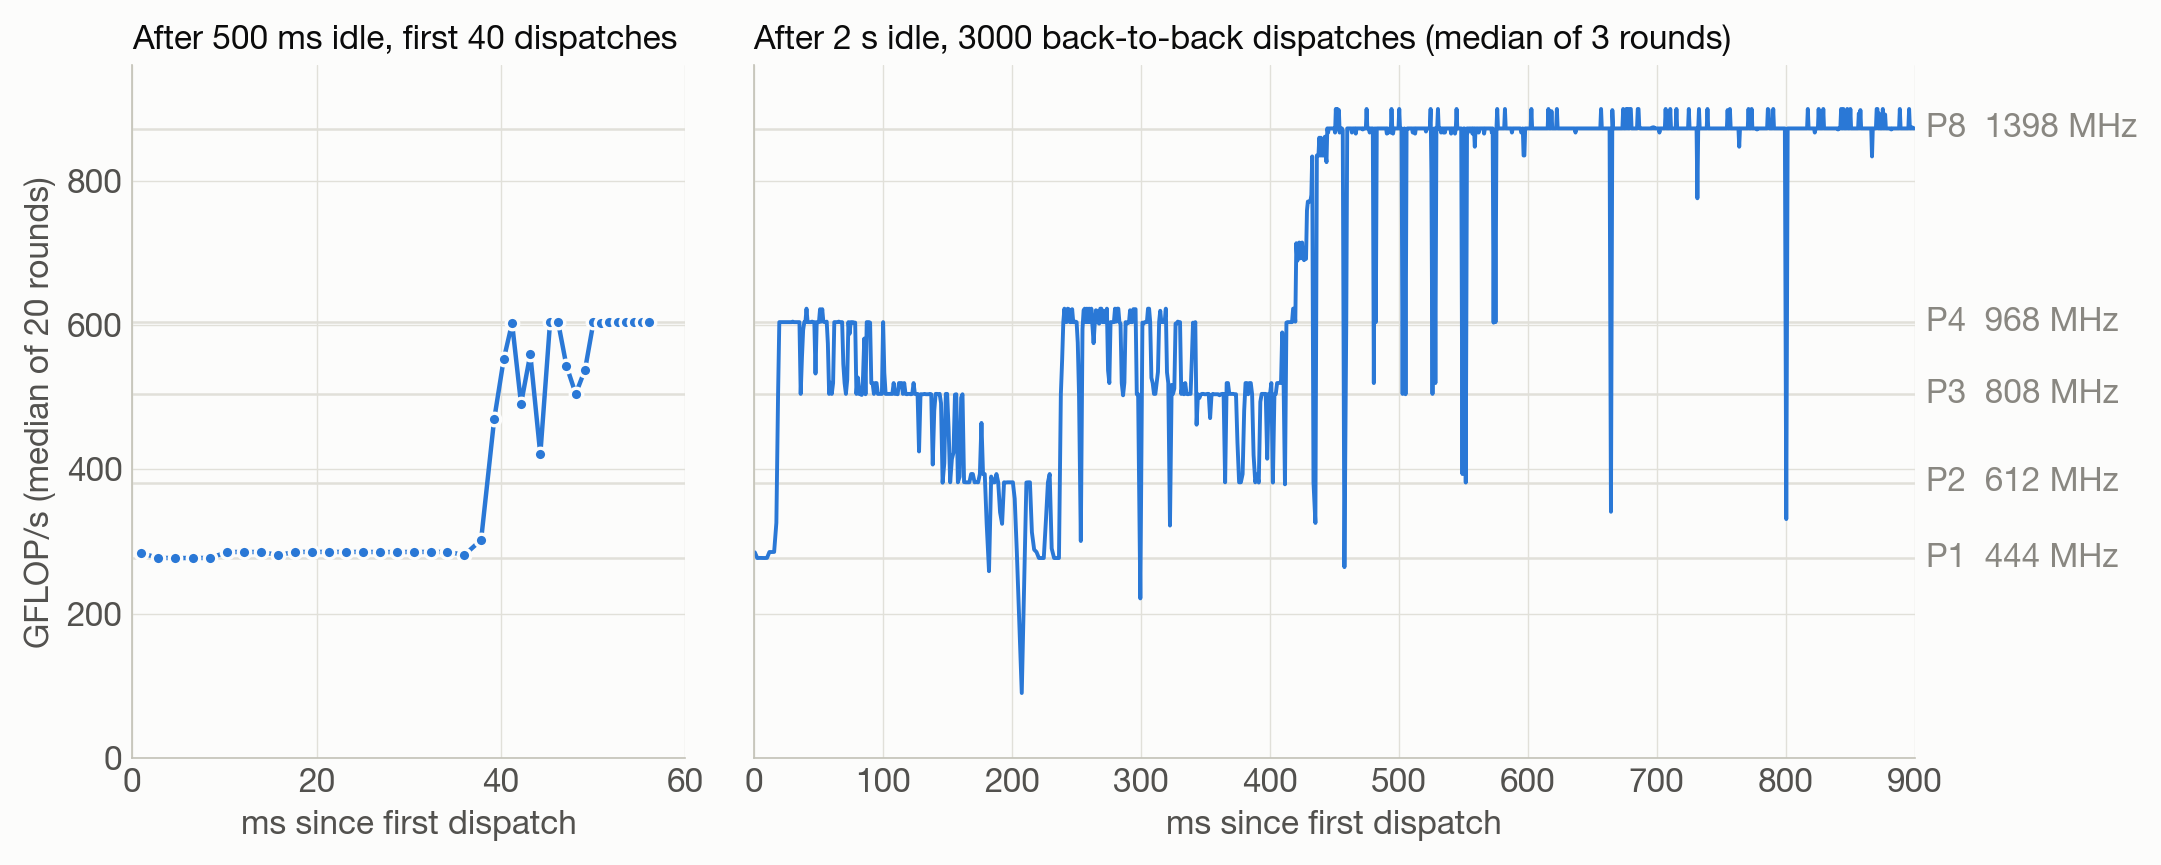
Execution throughput strictly aligns with predicted p-state
baseline values without intermediate drift. Following a 500
ms idle interval, dispatches 0 through 19 (spanning the
initial 37 ms) run at 277–302 GFLOP/s, corresponding to
p-state P1. The controller then executes a step transition,
elevating the GPU to P4 (604 GFLOP/s) by 47 ms. Following a
longer 2 s idle duration, the initial P1 plateau contracts
to 17 ms (dispatches 0–8). In the subsequent ramp-up,
dispatch 9 serves as a transient state, while dispatches 10
and 11 achieve P3 and P4 respectively within a 3 ms window.
Between 100 ms and 240 ms, execution rate decays through
P3 and P2 before re-ascending to P4, dropping back to P3,
and finally stepping sequentially through P5, P6, and P7
between 421 ms and 444 ms. The controller holds each
intermediate state for approximately one 8 ms sampling window
prior to stabilizing at P8 (872 GFLOP/s). Empirical throughput
during these discrete steps matches theoretical OPP clock
expectations precisely: 689–693 GFLOP/s versus 692 GFLOP/s
(P5), 771–772 GFLOP/s versus 771 GFLOP/s (P6), and 834–835
GFLOP/s versus 835 GFLOP/s (P7). Beyond 444 ms, throughput
remains pinned at P8, interrupted only by occasional single-dispatch drops.
Power State Decay & Persistence
While Figure 1 indicates that warm power states decay 50 ms after queue depletion, this observation is specific to sequential single-kernel submissions (six dispatches executed serially). Modern LLM prefill workloads issuing tens of command buffers concurrently to the queue. To evaluate this submission model, the idle-wake experiment was repeated by enqueuing 30 command buffers back-to-back without waiting for completion, recording the individual GPU execution time for every buffer.
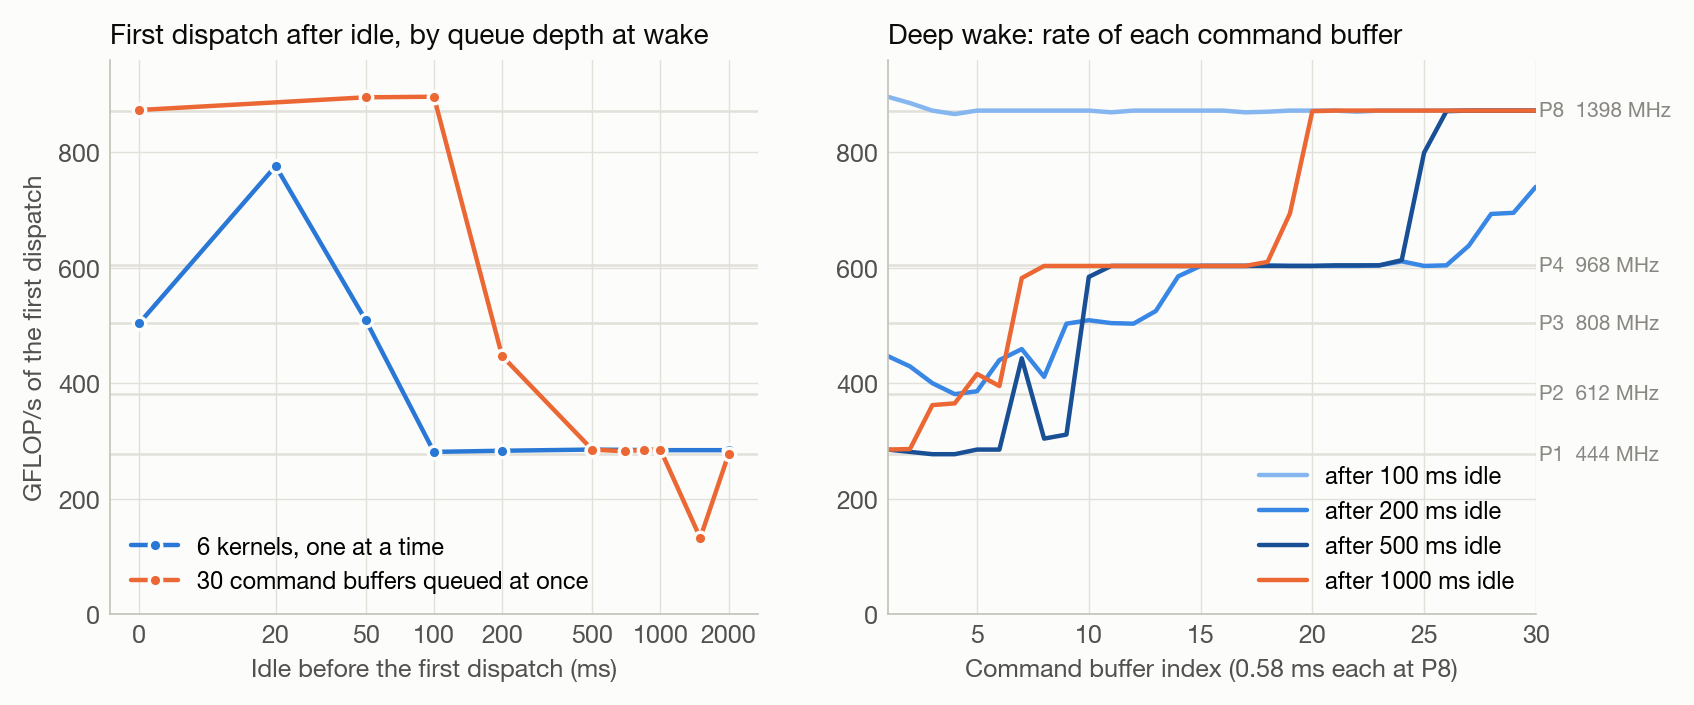
| idle (ms) | shallow wake, 1st dispatch (GFLOP/s) | deep wake, 1st dispatch (GFLOP/s) | deep wake, 30 buffers, wall (ms) | commit to GPU start (ms) |
|---|---|---|---|---|
| 50 | 509 | 895 | 20.6 | 0.67 |
| 100 | 281 | 896 | 21.0 | 0.66 |
| 200 | 283 | 447 | 35.2 | 0.62 |
| 500 | 285 | 285 | 37.4 | 0.58 |
| 1000 | 284 | 285 | 29.3 | 0.59 |
| 1500 | 132 | 38.3 | 1.88 | |
| 2000 | 284 | 277 | 37.2 | 1.75 |
With a deep queue, the first dispatch following a 50 ms or
100 ms idle interval executes at full P8 frequency, where
the shallow submission model previously registered P1. This
demonstrates that the warm power state persists past 50 ms;
rather, a shallow queue provides insufficient work for the
controller to trigger clock scaling. At 200 ms of idle time,
deep-queue execution initializes between P1 and P4 (447
GFLOP/s in this run and P1 in subsequent iterations), and
consistently drops to P1 beyond 350 ms.
Following this decay, the frequency scales across 15–25
command buffers, increasing total execution time for the
30-buffer burst to 29–38 ms compared to a 20 ms steady-state
duration. This introduces a 9–18 ms ramp tax under high queue
depth, compared to the 40 ms penalty observed in the
synchronous submission loop. Extending the pre-gap workload
duration to 60 ms or 300 ms to provide the controller with
additional active history yielded identical transition
parameters. Beyond approximately 1 s of idle time, a distinct
latency regime emerges: commit-to-start delay increases from
0.6 ms to 1.7–1.9 ms, and the initial command buffer incurs
~2 ms of internal overhead—the only performance penalty
evaluated that scales monotonically with idle duration.
This mechanism explains why token generation during decode
maintains maximum frequency states. During MLX decode phases,
IOReport telemetry indicates that the GPU enters an OFF state
for 3–5% of each 100 ms sampling interval. While host-side
CPU overhead per token is sufficient to power down the GPU
between steps, these idle durations remain well below the
state decay thresholds established above. Because each step
is submitted with sufficient queue depth, the GPU immediately
resumes execution at P8 without undergoing dynamic frequency
scaling (Figure 9).That also explains why decode holds the top
state.
Submission Pattern
The performance controller produces vastly different frequency scaling trajectories depending on the dispatch submission strategy. To establish baseline performance, steady-state throughput was evaluated across each configuration without active telemetry sampling (3 s run duration following a 300 ms idle period, with reported rates representing the median of the final 60% of dispatches).
| command buffers in flight | kernel length at full speed (ms) | GPU duty cycle | steady GFLOP/s |
|---|---|---|---|
| 1 | 0.07 | 40% | 846 |
| 1 | 0.29 | 61% | 869 |
| 1 | 1.16 | 82% | 874 |
| 1 | 2.32 | 91% | 902 |
| 4 | 0.07 | 79% | 847 |
| 4 | 0.29 | 91% | 869 |
| 4 | 2.32 | 99% | 902 |
Every submission pattern eventually converges at peak frequency (P8),
even a synchronous loop that leaves the GPU idle for 60% of total runtime.
(Shorter kernels exhibit lower GFLOP/s figures due to fixed per-command-buffer
dispatch overhead included within their GPU execution bounds, rather than lower p-states.)
The critical differentiator across submission strategies
is the cumulative GPU time lost during frequency scaling.
Integrating the execution time penalty of each dispatch
relative to its steady-state duration yields the following
loss bounds. Rows marked with † were measured alongside 10
ms IOReport sampling, which introduces slight overhead and
therefore represents an upper bound on ramp latency.
| pattern | GPU time lost by 100 ms | by 500 ms |
|---|---|---|
| sync, 0.58 ms kernels | 40.7 ms | 192.4 ms |
| sync, 0.07 ms kernels † | 42.8 ms | 187.1 ms |
| sync, 0.29 ms kernels † | 43.7 ms | 164.5 ms |
| sync, 6 ms kernels † | 28.9 ms | 45.5 ms |
| 4 in flight, 0.29 ms kernels † | 22.9 ms | 37.8 ms |
A synchronous loop waiting on individual short command buffers spends approximately 450 ms oscillating between P1 and P4 before stabilizing at P8, running at just 62% of steady-state throughput across its first 500 ms. In contrast, workloads utilizing longer individual kernels or maintaining a deep queue complete the frequency ramp in under 100 ms, limiting cumulative execution loss to 23–29 ms.
Queue Gaps
A synchronous submission loop without explicit sleep statements exhibits an inter-buffer dispatch gap of 0.1–0.3 ms on the GPU timeline (GPUStartTime[i+1] − GPUEndTime[i]) and reliably triggers frequency boosting. For inference runtimes, the critical operational threshold is the maximum allowable idle gap before the controller ceases to treat the queue as active. To isolate this boundary, the synchronous probe loop was evaluated with a fixed usleep injected after every waitUntilCompleted call, sweeping kernel durations across various sleep intervals (0.1 to 5.0 ms) across 3-second runs over two interleaved rounds.
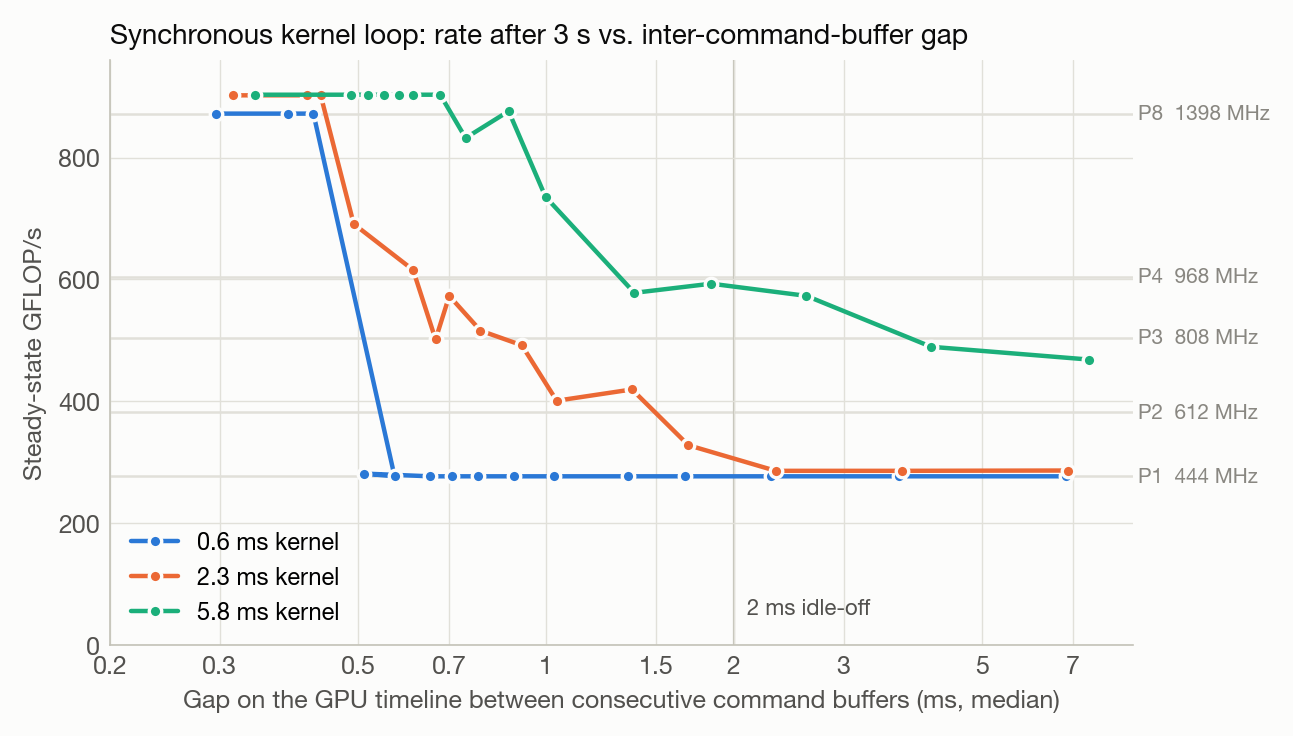
| kernel (ms at P8) | gap on GPU timeline (ms) | GPU duty | steady GFLOP/s | state |
|---|---|---|---|---|
| 0.58 | 0.28–0.43 | 63–73% | 872 | P8 |
| 0.58 | 0.57 | 75% | 277 | P1 |
| 0.58 | 0.65–6.8 | 22–74% | 277 | P1 |
| 2.32 | 0.31–0.44 | 85–88% | 902 | P8 |
| 2.32 | 0.48–0.50 | 85% | 662–720 | P5–P6 |
| 2.32 | 0.61–0.79 | 84–87% | 484–625 | P3–P4 |
| 2.32 | 1.0–1.4 | 79–84% | 393–444 | P2–P3 |
| 2.32 | 1.7–6.9 | 51–79% | 286–369 | P1 |
| 5.81 | 0.34–0.68 | 90–94% | 903 | P8 |
| 5.81 | 0.74–0.87 | 88–89% | 823–876 | P7 |
| 5.81 | 1.0 | 87% | 717–754 | P5–P6 |
| 5.81 | 1.3–1.9 | 80–87% | 472–714 | P3–P6 |
| 5.81 | 2.4–7.9 | 62–76% | 438–600 | P2–P4 |
The measurements reveal a sharp performance cliff at approximately 0.5 ms. A 0.58 ms kernel followed by a 0.43 ms gap maintains P8 execution at only 63% GPU utilization. However, extending the gap to 0.57 ms pins the same kernel at P1 (444 MHz) indefinitely; a extended 20 s run with a 0.77 ms gap similarly failed to trigger a single frequency ramp. Longer kernels exhibit graceful degradation rather than an abrupt cliff: a 2.3 ms kernel steps down progressively through P8, P5, P3, and P2 as the inter-buffer gap expands from 0.5 ms to 1.7 ms, while a 5.8 ms kernel sustains P8 up to a 0.7 ms gap and remains at P2–P4 even when power-gating occurs between individual dispatches.
The duty-cycle metric exposes the underlying control mechanism. Duty cycle remains essentially static across each kernel duration row because synchronous execution creates a self-reinforcing feedback loop: lower clock frequencies elongate kernel execution time, artificially elevating the observed duty cycle until the controller's 85% utilization target (apple,perf-tgt-utilization) is satisfied. The controller then stabilizes at the lowest p-state that meets this target—which, for the 5.8 ms kernel, corresponds to P3–P4. Conversely, the 0.58 ms kernel cannot meet this threshold at sub-millisecond execution times, remaining trapped at the frequency floor (444 MHz) at 74% duty cycle regardless of total runtime. Escaping this state requires the controller's boost path (apple,perf-boost-min-util), which strictly requires that queue idle gaps remain below ~0.5 ms—independent of compute unit occupancy during active cycles. Hardware occupancy is not the metric the performance controller evaluates.
In-flight command buffer pipelining closes this gap without requiring modifications to CPU-side application logic. Committing four command buffers ahead reduces the GPU timeline gap to 0.03–0.07 ms for identical sleep intervals, sustaining full P8 performance.
| kernel (ms at P8) | CPU sleep after each commit (ms) | gap on GPU timeline, 1 in flight | steady GFLOP/s, 1 in flight | gap, 4 in flight | steady GFLOP/s, 4 in flight |
|---|---|---|---|---|---|
| 0.58 | 0.3 | 0.78 | 277 | 0.03 | 872 |
| 0.58 | 0.5 | 1.03 | 277 | 0.04–0.07 | 872 |
| 0.58 | 1.0 | 1.67 | 277 | 0.42 | 622 |
| 0.58 | 1.5 | 2.29 | 277 | 0.52–0.54 | 382 |
| 2.32 | 0.3–1.5 | 0.79–2.35 | 286–521 | 0.03–0.04 | 902 |
Pipelining only masks CPU delays when the total runtime of queued work exceeds the dispatch gap. For example, four 0.58 ms kernels (2.32 ms total work) absorb a 0.5 ms delay, but fail against a 1.0 ms gap. In contrast, four 2.3 ms kernels provide 9.2 ms of buffered execution, easily masking a 1.5 ms gap.
A Model
What follows is a model consistent with the parameters and every measurement in this post.
every 8 ms:
    util   = fraction of the window with a command buffer queued or running;
             a queue that is empty for less than ~0.5 ms still counts as busy
    u_filt = u_filt + (util - u_filt) / 5              # 40 ms time constant
    if u_filt >= 0.90:  pstate = step_up(pstate)       # P1->P4 at once; P5..P8 a window each
    else:               pstate = pid_toward(u_filt, target = 0.85)
    if no work for 2 ms: power off; u_filt decays toward 0 while off
on wake:
    pstate = state implied by u_filt                   # P8 if woken with a deep queue within ~100 ms;
                                                        # P1 from ~200-500 ms; a deeper state past ~1 s
The 40 ms filter is behind both the plateau and the decay, the 0.5 ms tolerance is what separates a queue the controller boosts for from one it does not, and the ~0.3–0.6 ms of extra commit-to-start latency plus the ~0.6 ms slow first dispatch are the power-up itself, which is the only cost bandwidth-bound work pays.
Runtime Mitigation Strategies
1. Keep the queue populated
The brute-force mitigation is to prevent the performance controller from observing an empty queue when incoming requests are anticipated. This is achieved by dispatching a lightweight background kernel executing a long fused multiply-add (FMA) dependency chain across a single 32-thread threadgroup:
uint32_t iters = 200000;
while (session_is_interactive) {
    id<MTLCommandBuffer> cb = [queue commandBuffer];
    id<MTLComputeCommandEncoder> enc = [cb computeCommandEncoder];
    [enc setComputePipelineState:alu];
    [enc setBuffer:sink offset:0 atIndex:0];
    [enc setBytes:&iters length:4 atIndex:1];
    [enc dispatchThreads:MTLSizeMake(32, 1, 1) threadsPerThreadgroup:MTLSizeMake(32, 1, 1)];
    [enc endEncoding];
    [cb commit];
    [cb waitUntilCompleted];
}
This workload accesses no memory beyond a 4 KiB sink buffer while holding the GPU at P8 (1398 MHz). It incurs a power draw of 0.59 W on the GPU rail (compared to a 0.08 W baseline idle state) and ~0.08 W on the CPU to sustain submission. A ~0.5 W overhead to lock maximum clock frequencies during active user sessions (e.g., open chat contexts or autonomous agent loops) offers a favorable efficiency trade-off, whereas continuous background execution is prohibited by power-gating constraints.
Two parameters govern controller state transitions: the per-command-buffer ALU workload and the inter-commit queue idle duration. Power consumption was measured via IOReport Energy Model counters sampled at 500 ms intervals across three 8-second interleaved rounds. All evaluated sleep intervals remained below the 2 ms power-gating threshold (idle_off_delay_ms), ensuring the GPU remained powered throughout testing.
| keep-warm shape | kernel (ms) | GPU duty | GPU (W) | CPU (W) | P8 residency |
|---|---|---|---|---|---|
| none (idle) | — | — | 0.08 | 0.07 | 0% |
| 200k iters, back-to-back | 5.50 | 94% | 0.59 | 0.08 | 100% |
| 200k iters, 0.5 ms between commits | 5.50 | 87% | 0.34 | 0.05 | 0% |
| 200k iters, 1.5 ms between commits | 5.50 | 80% | 0.22 | 0.06 | 0% |
| 20k iters, back-to-back | 0.58 | 68% | 0.55 | 0.45 | 100% |
| 2k iters, back-to-back | 0.07 | 23% | 0.52 | 1.11 | 97% |
| empty kernels, back-to-back | 0.009 | 6% | 0.45 | 1.67 | 71% |
This behavior highlights the queue-gap threshold from a power perspective. Command buffers executing for 0.07 ms and submitted back-to-back leave the GPU idle for 77% of total runtime yet consistently sustain P8. Conversely, 5.5 ms kernels with 0.5 ms injected sleep maintain an 87% GPU duty cycle but fail to trigger boost logic, locking execution at P1 (444 MHz) indefinitely. Crucially, keeping the GPU powered on is distinct from sustaining maximum clock frequency; only the latter delivers performance benefits.
Furthermore, GPU power draw remains virtually constant (0.52 to 0.59 W) across a 100× variation in dispatch frequency because power consumption is dominated by P8 voltage and clock domains on an otherwise idle processor. In contrast, host-side CPU submission overhead scales inversely with kernel duration, increasing from 0.08 W (5.5 ms kernels) to 1.11 W (0.07 ms kernels). Consequently, the most energy-efficient keep-warm kernel is the longest acceptable workload rather than the smallest. Null/empty command buffers represent the worst-case configuration, consuming 1.67 W of CPU power while holding P8 for only 71% of total runtime.
2. Pre-warming via predictive signals
Rather than incurring continuous power overhead, a more efficient strategy dispatches a dummy workload upon receiving predictive input signals (e.g., keystroke events, socket accept calls, or initial tokenization steps) to saturate the queue before request arrival. To quantify the required lead time following a 1 s idle period, prefill performance was evaluated after executing pre-warm matrix multiplication bursts of varying duration: a 2048² fp32 matmul (~6 ms kernel execution, single in-flight) and a 256² fp32 matmul (sub-millisecond execution, single in-flight).
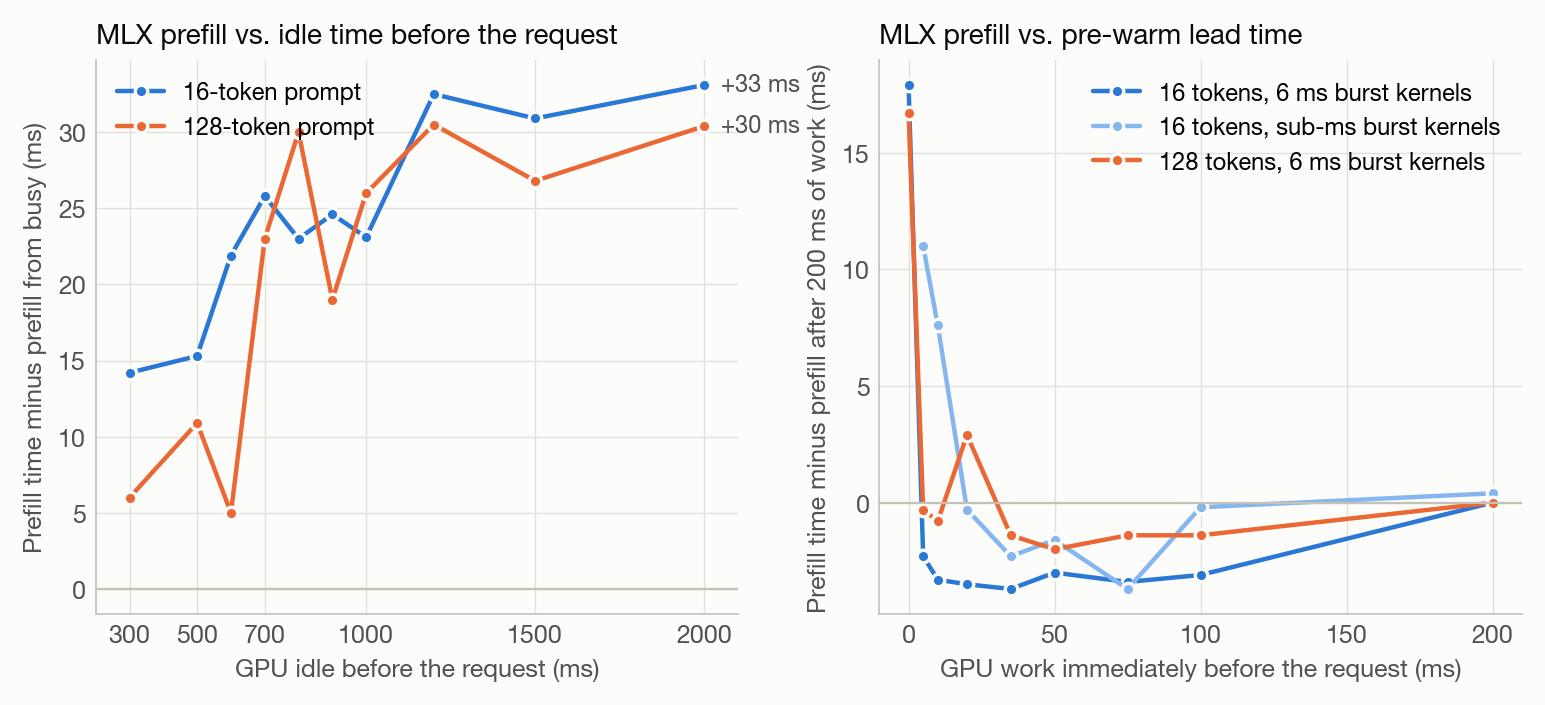
| pre-warm before request (ms) | burst kernels | 16 tokens, 6 ms kernels | 16 tokens, sub-ms kernels | 128 tokens, 6 ms kernels | 128 tokens, sub-ms kernels |
|---|---|---|---|---|---|
| 0 (idle 1 s) | 0 | 134.5 | 419.3 | ||
| 5 | 1 / 12 | 114.3 | 127.6 | 402.3 | 420.9 |
| 10 | 1 / 27 | 113.3 | 124.2 | 401.8 | 422.7 |
| 20 | 2 / 51 | 113.1 | 116.3 | 405.5 | 402.3 |
| 35 | 3 / 112 | 112.9 | 114.3 | 401.2 | 402.6 |
| 50 | 5 / 171 | 113.6 | 115.0 | 400.6 | 401.8 |
| 100 | 11 / 349 | 113.5 | 116.4 | 401.2 | 402.3 |
| 200 | 23 / 800 | 116.6 | 117.0 | 402.6 | 403.9 |
Figure 7 illustrates that a single 6 ms kernel submitted 5 ms prior to request arrival fully eliminates the cold-start prefill penalty across short and long prompts (reducing latency from 134.5 ms to 114.3 ms and 419.3 ms to 402.3 ms, respectively). Conversely, sub-millisecond kernel bursts require 20 ms to achieve the same frequency transition because serial short dispatches follow the slow ramp path. Pre-warming does not require sustained execution; it simply requires a substantial compute kernel that remains queued when the initial prefill command buffer lands behind it. Because 5 ms is shorter than typical network round-trips or inter-keystroke intervals, interactive paths provide sufficient lead time for predictive pre-warming.
3. Inter-buffer idle budget enforcement
Within an active request, the ~0.5 ms inter-buffer tolerance establishes a strict host dispatch budget. For a synchronous loop, CPU submission overhead approaches this threshold: the completion-to-start round trip of a command buffer requires 0.28–0.34 ms on the GPU timeline. Injecting a 0.125 ms CPU sleep maintains P8, whereas a 0.15 ms sleep exceeds the threshold, triggering frequency decay that persists until continuous queue saturation is restored. Maintaining four in-flight command buffers resolves this by allowing CPU-side encoding to absorb dispatch jitter. This constraint similarly dictates chunk sizing in chunked-prefill architectures: each chunk's execution duration must exceed the CPU time required to encode the subsequent chunk.
Framework implementations reflect these theoretical bounds. The `llama.cpp` Metal backend partitions graph evaluations across a small set of co-committed command buffers (`n_cb`), following the fast frequency ramp path and incurring a modest 14–18 ms cold-start penalty. In contrast, MLX enforces finer-grained synchronization points, incurring a 33–53 ms penalty under identical cold-start conditions.
Between requests, scheduler behavior governs power state continuity. If the queue drains upon request completion, the GPU returns to baseline frequency states regardless of prior compute saturation. Multi-tenant schedulers with pending requests must commit the initial command buffer of an incoming query before the preceding query's final command buffer completes execution on the GPU.
4. Idle decay budgeting
When no subsequent requests are queued, the decay window determines when the cold-start penalty re-emerges. For LLM prefill execution, Figure 7 (left panel) demonstrates a 5–15 ms latency penalty following 300–500 ms of idle time (corresponding to the deep-wake ramp tax), which reaches the maximum 20–33 ms penalty beyond 600–700 ms.3
Within 100 ms of queue depletion, no performance loss occurs if the incoming request is issued with high queue depth. Consequently, keep-warm routines should be disabled during token generation (where GPU idle gaps remain sub-millisecond) and during the initial 100 ms post-request window. Keep-warm mechanisms should operate exclusively within the 200 ms to multi-second window where incoming requests are expected.
Agentic workflows comprising rapid, sequential inference passes interleaved with host-side processing—such as re-ranking, routing, embedding generation, tool-use loops, and speculative execution—are particularly vulnerable to these dynamics. A tool call requiring 500 ms of CPU execution returns control to the inference engine with the GPU pinned at 444 MHz on every iteration.
Results
Time-to-first-token was measured as prefill wall time (prompt submission to first logits generation) in three conditions interleaved round-robin.
- Idle: 1 s with no GPU work before the request.
- Busy: a GPU burn immediately before the request.
- Keep-warm: idle, but with the keep-warm loop above running in a separate process.
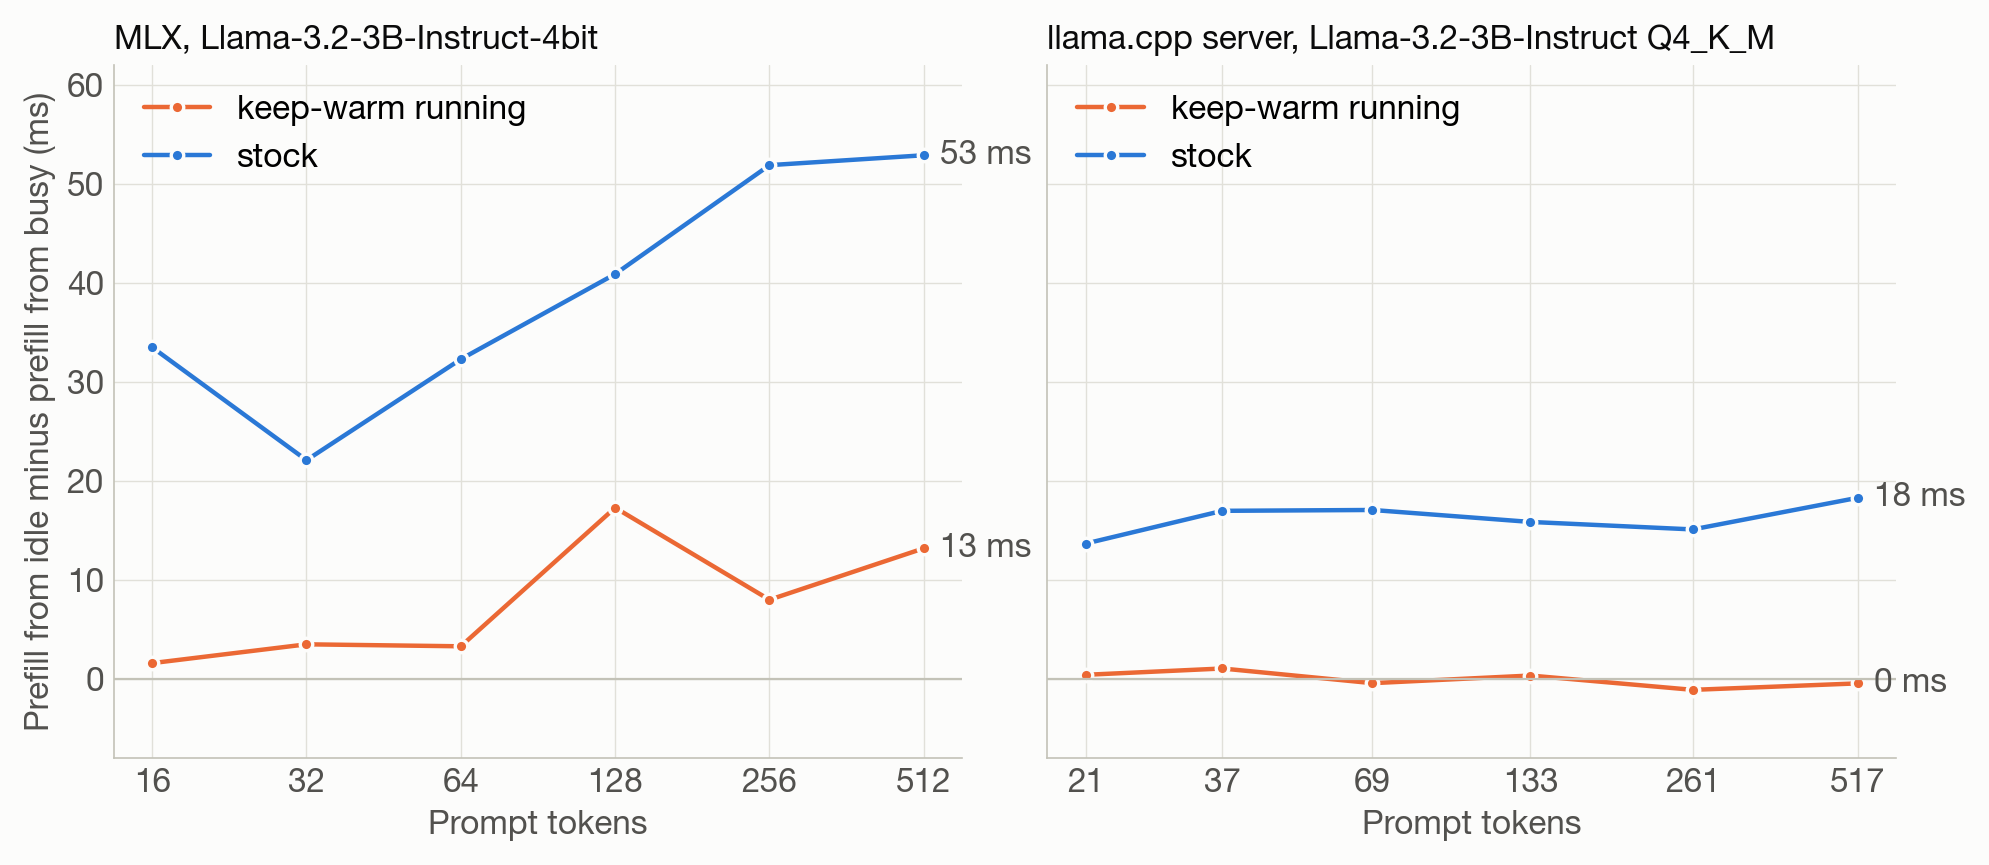
Time to First Token
MLX, Llama-3.2-3B-Instruct-4bit
mlx_lm 0.31.1, 8 rounds per cell, busy
= 60 ms of matmul immediately before the request.
| prompt tokens | idle (ms) | busy (ms) | penalty | keep-warm idle (ms) | keep-warm busy (ms) | penalty |
|---|---|---|---|---|---|---|
| 16 | 149.9 | 116.4 | +33.5 ms (1.29x) | 117.2 | 115.6 | +1.6 ms |
| 32 | 129.3 | 107.2 | +22.1 ms (1.21x) | 111.3 | 107.8 | +3.5 ms |
| 64 | 240.8 | 208.5 | +32.3 ms (1.15x) | 212.2 | 208.9 | +3.3 ms |
| 128 | 444.9 | 404.0 | +40.9 ms (1.10x) | 419.1 | 401.8 | +17.3 ms |
| 256 | 849.1 | 797.2 | +51.9 ms (1.07x) | 810.7 | 802.7 | +8.0 ms |
| 512 | 1655.1 | 1602.2 | +52.9 ms (1.03x) | 1618.8 | 1605.6 | +13.2 ms |
The prefill penalty expands with prompt length before saturating at ~52 ms once prefill duration exceeds the frequency ramp duration, aligning with finite ramp model predictions. This saturation limit lies between the fast-path latency loss (23–29 ms) and the synchronous-path loss (~190 ms) established in the submission pattern benchmarks. Executing the keep-warm routine eliminates 58–95% of this latency overhead in these tests without degrading busy-state throughput, which remains within 1%. The remaining 2–17 ms residual latency does not reflect an underlying hardware mechanism: benchmark iterations performed on an isolated system demonstrate that keep-warm idle and busy measurements converge within 1 ms at 16 and 128 token prompt lengths, and maintaining CPU activity during the 1 s idle gap (via core spinning or thread busy-waiting) yields no measurable difference.
| keep-warm running, quiet machine | idle 1 s (sleep) | idle 1 s, one CPU core spinning | idle 1 s, busy-wait on this thread | busy |
|---|---|---|---|---|
| 16 tokens | 109.6 | 109.1 | 108.4 | 110.2 |
| 128 tokens | 387.1 | 386.5 | 387.4 | 386.3 |
llama.cpp, Llama-3.2-3B-Instruct Q4_K_M
llama-server, all layers on GPU,
timings.prompt_ms from the server, 6
rounds per cell, busy = a 200-token request
immediately before.
| prompt tokens | idle (ms) | busy (ms) | penalty | keep-warm idle (ms) | keep-warm busy (ms) | penalty |
|---|---|---|---|---|---|---|
| 21 | 122.1 | 108.4 | +13.7 ms (1.13x) | 109.1 | 108.7 | +0.4 ms |
| 37 | 215.9 | 198.9 | +17.0 ms (1.09x) | 201.3 | 200.3 | +1.1 ms |
| 69 | 309.8 | 292.7 | +17.1 ms (1.06x) | 296.4 | 296.8 | −0.4 ms |
| 133 | 501.8 | 485.9 | +15.9 ms (1.03x) | 489.8 | 489.4 | +0.3 ms |
| 261 | 888.6 | 873.5 | +15.1 ms (1.02x) | 878.2 | 879.3 | −1.1 ms |
| 517 | 1641.4 | 1623.1 | +18.3 ms (1.01x) | 1632.2 | 1632.6 | −0.4 ms |
llama.cpp incurs a flat 14–18 ms cold-start penalty, reflecting the combined overhead of the deep wake ramp tax (9–17 ms) and initial power-up latency. Enabling the keep-warm routine completely eliminates this performance tax, bringing every residual timing measurement within 1.1 ms of the baseline.
Decode
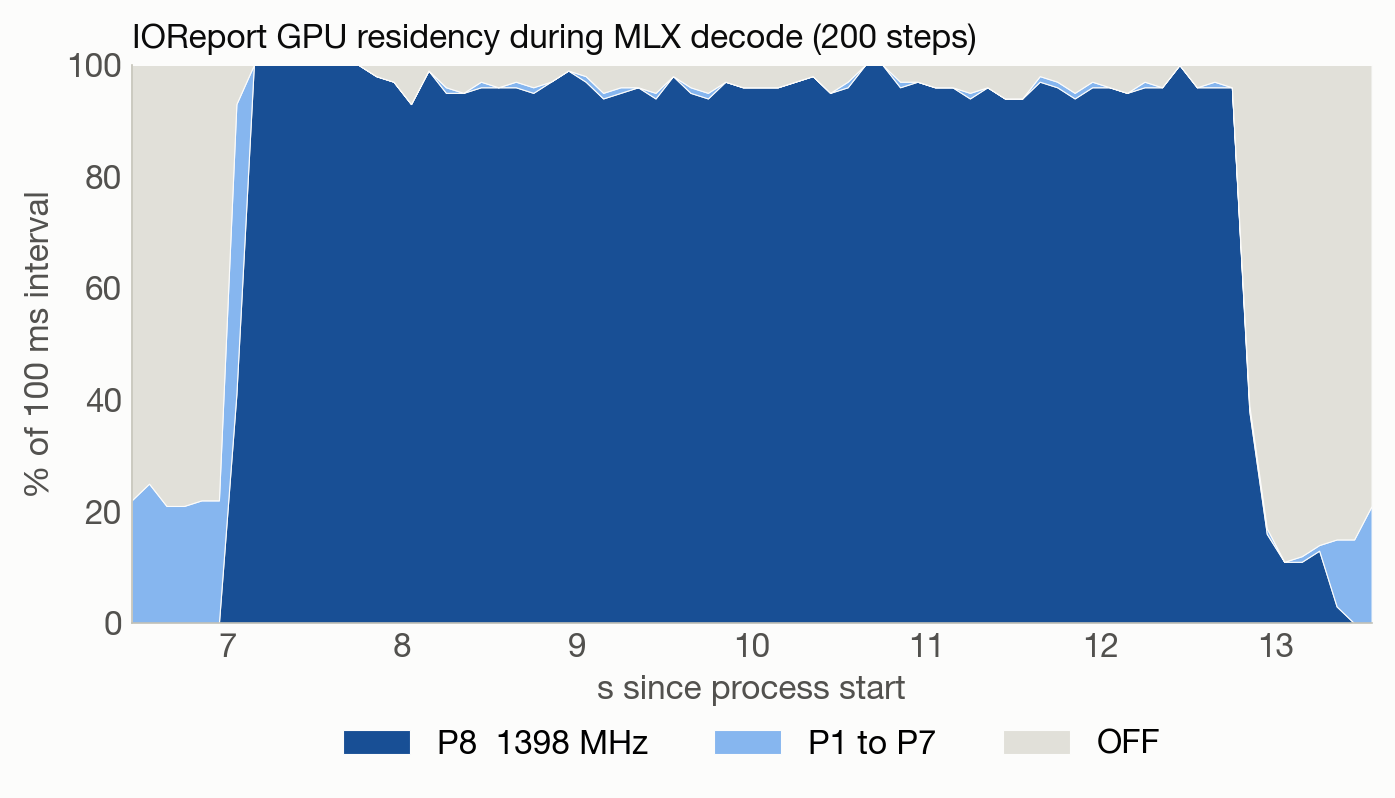
Token generation is exempt from the cold-start penalty
for two independent reasons. First, decode is
bandwidth-bound, and the memory-path experiment
established that DRAM throughput saturates at the
baseline p-state, so the achieved clock frequency has
no bearing on per-token latency. Second, decode never
permits the controller to decay. Across 200 MLX decode
steps, IOReport residency shows the GPU in the OFF
state for 0–7% of each 100 ms interval, in P8 for
93–100%, and in P1–P7 for at most 1% after the initial
100 ms (Figure 9). The host-side work between steps is
long enough to trigger the 2 ms power-off but well
below the decay thresholds established above, and each
step is submitted with sufficient queue depth to resume
at P8 directly.
The keep-warm routine imposes no measurable cost on
this phase. Across two interleaved rounds of 200
steps, median step time was 26.95 and 28.29 ms with
the stock configuration and 27.45 and 26.76 ms with
keep-warm active. The between-condition differences
(−0.5 and +1.5 ms) are smaller than the between-round
variation of the stock configuration alone (1.3 ms),
so any per-token power-up overhead lies below the
resolution of this measurement.
Per Request
Because cold-start frequency scaling imposes a fixed latency tax at the beginning of each request, its relative performance impact depends directly on subsequent decode generation length. For MLX executing a 16-token prefill prompt at 27 ms per decode step:
| request shape | busy GPU | idle GPU | slowdown |
|---|---|---|---|
| time to first token | 116 ms | 150 ms | 1.29x |
| 1 token out (classify, route, score) | 116 ms | 150 ms | 1.29x |
| 5 tokens out | 224 ms | 258 ms | 1.15x |
| 50 tokens out | 1439 ms | 1473 ms | 1.02x |
| 200 tokens out | 5489 ms | 5523 ms | 1.006x |
Notes
-
Setup: MacBook Air, Apple M2 (8-core GPU,
applegpu_g14g), 8 GB LPDDR5, macOS 26.6.2 (25G83), Xcode 26.4.1, MLX 0.31.1, llama.cpp build 8980, on AC power with Low Power Mode off (it caps the GPU clock, sopmset -gis checked before every run) and no other applications running. All GPU timing isMTLCommandBuffer.GPUStartTime/GPUEndTime. Every configuration is interleaved round-robin across rounds, and medians are reported unless noted. A 300 s sustained run of the probes below showed no thermal drift (per-minute means 890–899 GFLOP/s), so every effect in this post is a transient of seconds or less. ↩ - This difference is because the approximately 20 µs of fixed per-command-buffer overhead within GPUStartTime..GPUEndTime constitutes a proportionally larger fraction of the total execution time for shorter kernels. ↩
- A preliminary benchmark sweep utilizing coarser timing resolution showed negligible penalty up to 500 ms, placing the 300–600 ms window near the measurement noise floor; the performance drop at 700–1000 ms is distinct and repeatable. CPU busy-waiting instead of thread sleeping produces negligible differences on FMA probes and reduces MLX prefill latency by a few milliseconds. ↩